
Support
Lumen Monitor is a menu bar app and a set of desktop widgets for your Mac. It shows CPU, memory, and free space on each physical disk, plus the optional readings you turn on.
1. Read the menu bar
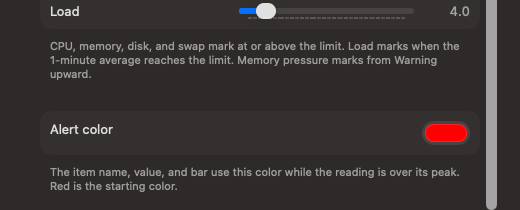
The item at the right of the menu bar is the live glance. It shows only the readings you turn on, in the order you choose. A reading turns the alert color when it passes its peak.

Click the item, then choose Open Window for every reading, or Settings… to change what appears. Settings is also Command-Comma.
2. Open the window
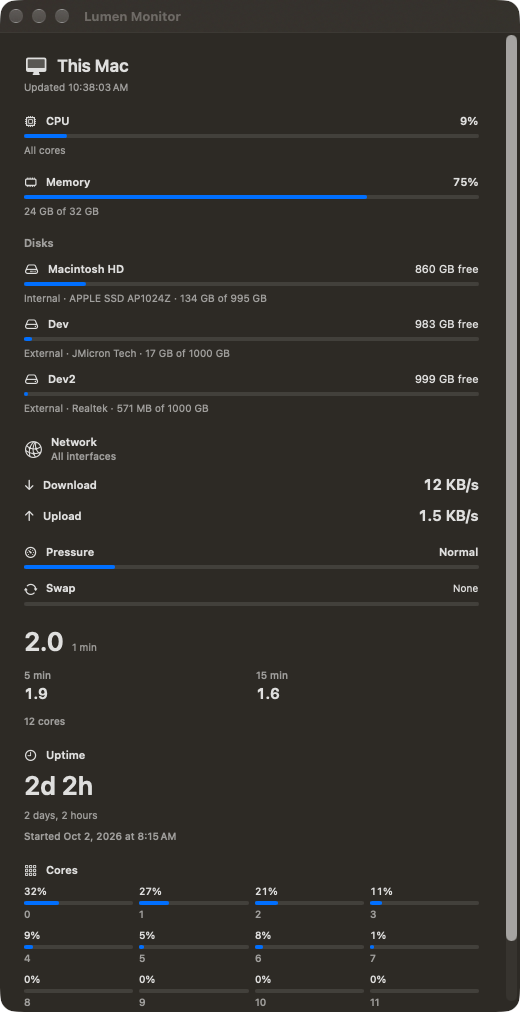
The window lists every reading: CPU, memory, each physical disk, network, memory pressure, swap, load, uptime, and the cores. Click a disk name to reveal that volume in Finder. The same numbers are what the widgets draw.
3. Set a peak
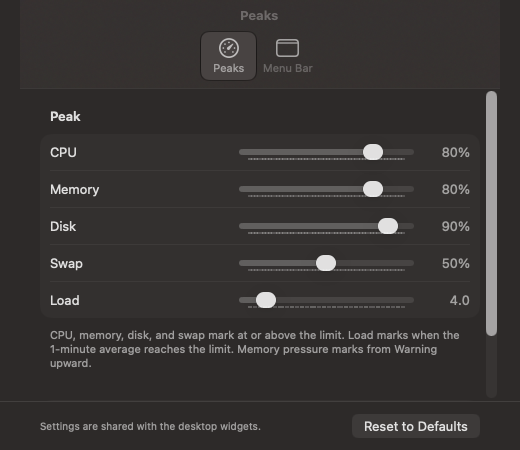
Settings has two tabs. Peaks is the limit for each reading. CPU, memory, disk, and swap mark at or above the limit. Load marks when the 1-minute average reaches the limit. Memory pressure marks from Warning upward. Thermal marks from Fair upward on Apple silicon. On a Mac with a battery, a Battery low slider appears and marks at or below its limit while running on battery.
4. Choose the menu bar readings
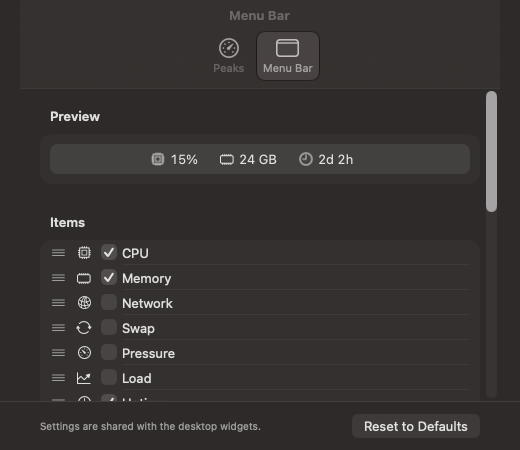
The Menu Bar tab has a preview of the item, then the list. Check a row to show it. Drag a row by the handle on the left to change the order. Scroll the list for Uptime, Cores, and each disk. Cores shows the busiest core. Battery is listed only when this Mac has one installed.
Further down the same tab, pick the network interface and how disks are labeled. Name is the volume, such as Macintosh HD. Volume is the physical disk, such as the SSD model. No name shows only the size figure. Disk value chooses Free (default), Used, % Free, or % Used for every disk in the menu bar. All interfaces skips loopback and Apple’s hidden links.
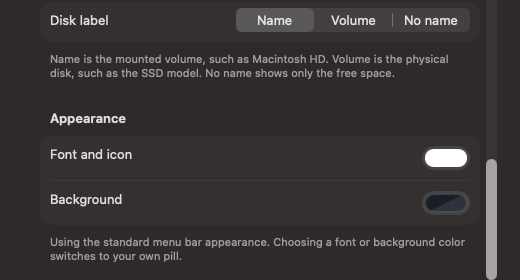
These settings are shared with the desktop widgets.
5. Add widgets
Open Lumen Monitor once, then Control-click the desktop and choose Edit Widgets. Search for Lumen Monitor. Add only the ones you want. Gauges are the rings. History, Network History, Disk I/O History, Pressure History, Load History, and Battery History are the charts. Battery, Memory, Network, Disk I/O, Pressure, Thermal, Load, Uptime, Cores, Top CPU, and Top Memory are each their own widget. App Monitor can watch an application or a process ID you type in (Top CPU and Top Memory show PIDs).
Widget colour is a macOS setting, not something Lumen picks per widget. In System Settings → Desktop & Dock → Widgets, Dim widgets on desktop can be Automatically (muted while you work in other windows), Always muted, or Never (always full colour with the system accent). That is why widgets can look grey on the screen you are using and colourful on another. The thumbnails below were taken with dimming set to Never.
While the menu bar app is running, history samples keep filling in more steadily, and Top CPU, Top Memory, App Monitor, Network, Network History, Disk I/O, and Disk I/O History usually refresh more often (about every 15 seconds when the system allows).
Settings → Menu Bar → Interface sets the network link for the menu bar and window. Each Network or Network History widget can override that in Edit Widget (All interfaces, or one specific link such as Wi-Fi). Widgets you already had keep working on All interfaces until you change them.
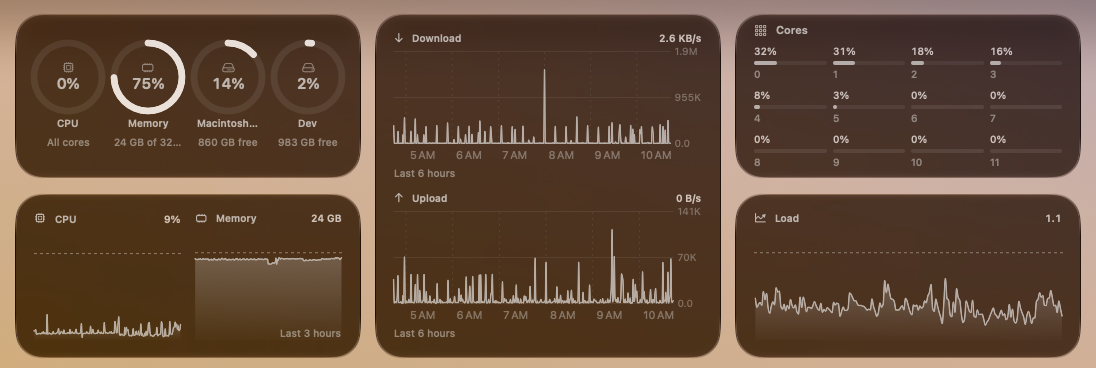
A chart needs two samples before it draws. The app records about one sample a minute while it is running. Until then a history widget says it is collecting history.
Widgets in the gallery
Readings
History
What is memory pressure?
Memory pressure is how hard this Mac is working to keep enough RAM free for what you are doing. It is not CPU heat, and it is not a percentage Lumen invents. macOS itself reports a level; Lumen Monitor reads that level and shows it as Normal, Warning, Urgent, or Critical.
When pressure rises, the system may compress memory, free caches, or page to disk. That is why the Pressure widget and menu bar row also show swap: how much of the on-disk swap file is in use. Pressure and swap describe the same shortage from two angles.
How Lumen computes it
- Pressure level — read from the kernel value
kern.memorystatus_vm_pressure_level. The kernel reports a small set of codes: 1 is Normal, 2 is Warning, 4 is Urgent, and 8 is Critical. Lumen maps those codes to the labels above. The bar under the label is only a visual mark for that step (Normal near the low end, Critical full); it is not a measured percent of RAM. - Swap — read from
vm.swapusage: bytes used and bytes total. The swap bar is used ÷ total when swap exists.
In Settings → Peaks, memory pressure marks with the alert color from Warning upward. Swap has its own peak (starting at 50% of swap space).
Contact
Email me@wbevan.com.